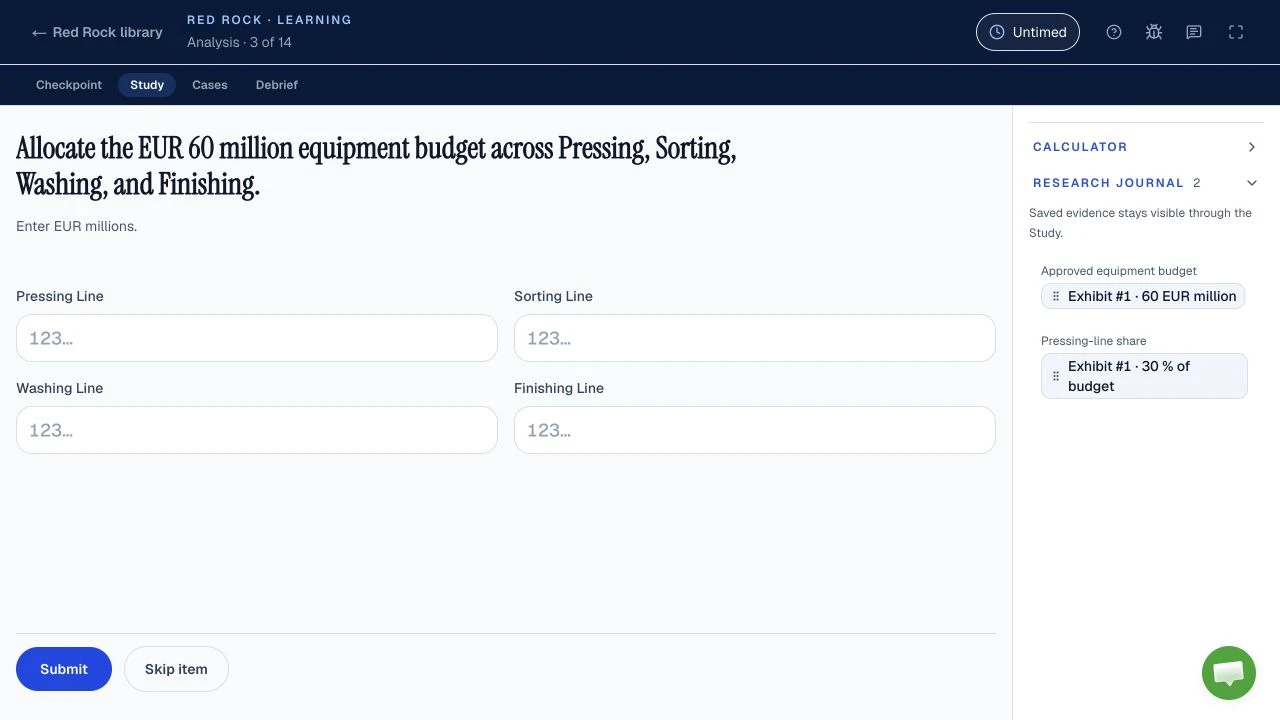
Candidates report percentages, ratios, averages, growth and chart reading in Red Rock, but McKinsey does not publish its question mix. The safest preparation is to make the denominator, period and unit explicit before calculating. This guide works the reported arithmetic on one original survey, then shows how each plausible wrong answer arises.
| Question | Answer | Status |
|---|---|---|
| Which calculation types? | Percentages, shares, ratios, averages and growth are described by candidates. | Reported, unverified mix |
| Can I use a calculator? | An in-game calculator is described by candidates; an outside calculator is barred by McKinsey’s general integrity rules. | Reported in-game; official outside-tool rule |
| What precision is required? | No universal Red Rock rounding rule or answer tolerance is public. | Not published |
| Does the tutorial help? | Each Solve task begins with an untimed tutorial for its objective and navigation. | Official, Solve FAQ |
The survey below is original. Its figures teach arithmetic, not a McKinsey question, score or prediction. McKinsey names Solve as a game-based assessment but does not publish a Red Rock blueprint.
What math should you prepare for McKinsey Red Rock?
Prepare percentage change, percentage points, shares, ratios, weighted averages, multi-period growth, unit conversion and reverse percentage for Red Rock: accounts mention these kinds of arithmetic, though no exact topic list or frequency is published. The operations are familiar, but the question decides which operation is useful. If it says “of the total,” build the total. If it says “increase from,” divide by the start. If it says “overall rate,” pool the underlying counts.
Reported Red Rock also asks you to read exhibits and select a chart, so a correct calculation still needs a precise label. The Red Rock format and practice guide owns the Study, journal, Report and Cases; this page stays with the arithmetic. If you are new to the full assessment, start with the McKinsey Solve guide; for its main difficulty points, read where Solve gets hard. The only official starting point for the assessment itself is McKinsey’s Solve page.
Use this sequence whenever an exhibit looks busy: write what is being asked, copy the relevant numbers with their periods and units, build the numerator and denominator, estimate, then calculate. It is editorial practice advice, not a claimed McKinsey scoring rule. To practise the same arithmetic on fresh data, work the six worked Red Rock mini-cases; for a timed rehearsal after the worked examples, choose a game in the free McKinsey Solve simulation.

Opening your Red Rock run…
The Red Rock run did not open here.
How can one survey support every calculation type?
One original seedling survey supplies every worked calculation below: two zones, three springs, land area and health inspections, with no claim that McKinsey uses this dataset or asks this exact mix. The first job is to distinguish the population counts from the inspected sample. A question about seedlings across springs uses the population columns. A question about the fraction found healthy uses inspected and healthy counts. Do not divide one by a count from the other just because both refer to seedlings.
| Zone | Area | Seedlings by spring | Healthy / inspected |
|---|---|---|---|
| Ridge | 0.4 km² | 120 → 144 → 180 | 27 / 30 |
| Valley | 0.6 km² | 80 → 96 → 120 | 36 / 60 |
| Combined | 1 km² | 200 → 240 → 300 | 63 / 90 |
Survey data, both zones added together. The vertical scale starts at zero, so the slope is drawn to scale.
Keep a compact label beside each figure in your own practice: “Ridge, final spring, seedlings,” or “Valley, inspected sample, healthy.” That is the quickest way to notice when a tempting denominator belongs to another period or another population. The Solve tips guide discusses this evidence-handling habit in the wider game.
How do you calculate percentage change and percentage points?
In this survey, the combined seedling count rose 25% from the middle to the final spring, while the two zone health rates differ by 30 percentage points; those are different questions, and McKinsey has not published how often either appears. In both, name the two things being compared before typing. A percentage change needs an original amount as its base. A percentage-point difference subtracts two percentages directly.
Percentage change: divide the difference by the starting count
The combined count went from 240 to 300, an increase of 60. Divide that increase by the count you started from.
Percentage change
Tempting wrong answer
Divides the increase by the ending count. That answers a different comparison: the increase as a share of the new total.
Right setup
Divides by the starting count, the base that “increase from” names.
A quick estimate helps: the added seedlings are about one quarter of the starting group, so a result near one fifth signals the wrong base.
Try a Redrock practice question on this: McKinsey Redrock practice questions, case 1 (percentage change).
Percentage points: subtract rates, then divide only for relative change
Start with each zone’s inspected health rate: healthy seedlings divided by the seedlings inspected in that zone.
Inspected health rate
The gap between two rates is a subtraction, and its unit is percentage points. If the question instead asks how much higher Ridge’s rate is relative to Valley’s, divide the gap by Valley’s 60% base.
Relative difference
Ridge’s rate is 50% higher than Valley’s.
Wrong label
Uses the point gap as if it were a relative percent.
Right label
“Points” means subtract the rates. “Percent higher than Valley” means compare the gap with Valley’s rate.
Try a Redrock practice question on this: case 6, a written finding that separates points from percent.
How do you find a share, a ratio and an overall rate?
In the final-spring data, Ridge contributes 60% of all seedlings, the Ridge-to-Valley count ratio is 3:2, and the pooled healthy rate is 70%; these operations appear in candidate accounts, with no known question mix. A share compares part with whole. A ratio compares one part with another. An overall rate pools the numerators and denominators before dividing.
Share of total: first build the matching whole
Ridge has 180 seedlings in the final spring. The whole it belongs to is both zones in that same spring, so add them before dividing.
- Ridge180 · 60%
- Valley120 · 40%
- Both zones300 · 100%
Share of total
Tempting wrong answer
Divides Ridge by Valley. That is a part-to-part comparison, so it can exceed a whole.
Right setup
Divides the part by the whole it belongs to, in the same spring.
The mental check is that a true share cannot be above a complete whole, and all zone shares must sum to that whole. Earlier-spring counts do not belong in the final-spring denominator.
Try a Redrock practice question on this: case 2, a share of a camp water budget.
Ratio: keep the order of the named groups
A ratio sets one named group against another, in the order the question names them. Write the two counts with their labels, then cancel the common factor.
Ridge to Valley
Both sides divided by 60.
Tempting wrong answer
Compares Ridge with the combined total. That is a share written as a ratio, not Ridge to Valley.
Right setup
Compares the two named groups, Ridge first because the question names it first.
If the question reverses the names, reverse the ratio. A ratio has no percent sign unless the question asks you to convert it.
Try a Redrock practice question on this: case 4, comparing rates when totals differ.
Weighted versus simple average: pool the inspected counts
The Ridge inspected rate is 90% and the Valley rate is 60%, but the inspected groups differ in size. Valley supplies two thirds of the inspected seedlings, so the overall rate sits closer to Valley’s.
- Ridge30 · 33.3%
- Valley60 · 66.7%
- All inspected90 · 100%
Overall healthy rate
Equal-zone trap
Averages the two rates, which gives the smaller Ridge sample the same influence as Valley’s larger one.
Pool first
Total successes over total opportunities. The inspected count supplies each rate’s weight.
The shortcut for any “overall,” “combined” or “across both” rate is total successes over total opportunities. A simple average is appropriate only if the question truly gives equal weight to each zone as a zone. The Sea Wolf guide uses averages for a different decision, checking a selected combination against site rules, and Sea Wolf math turns those average ranges into sum targets.
Try a Redrock practice question on this: case 3, a pooled rate across three stations.
How do you work growth across several periods?
The seedling total grew 50% across both intervals and its equivalent constant rate is 22.47% per interval; candidate accounts mention multi-period growth, but McKinsey has not published a Red Rock growth formula list. The first interval rises 20%, and the second rises 25%. Because the second rate applies to a larger base, adding those rates does not give the total change.
Check the endpoints first: total growth compares the final count with the first one.
Total growth across both intervals
Tempting wrong answer
Adds the two rates and drops the compounding. The second rate applies to a larger base.
Right setup
Multiplies the growth factors. The product must equal final ÷ first.
You do not need to infer an annual calendar from the labels: these are two observation intervals, so call the equivalent rate “per interval.” If periods are unequal, a simple square-root annualisation would be inappropriate.
If the question explicitly asks for the constant rate over the two equal intervals, take the square root of final ÷ first and subtract one.
Constant rate per interval
The result is displayed to two decimals for readability here. That display precision is an editorial choice, not a claimed Red Rock marking rule. Whether a reported in-game calculator or journal helps with a given step is covered in the Red Rock calculator and journal section. For pacing and how much time to reserve for the reported Cases, use the Red Rock practice method and the 35-minute Red Rock time budget, rather than treating any single arithmetic problem as a time target.
How do you convert scale and work backward from a percentage?
In this survey, the combined area is 100 hectares and the middle-spring count recovered from the final count is 240; unit conversion and reverse percentage are useful preparation, but McKinsey has not confirmed either as a required Red Rock topic. Both tasks are about reversing a relationship before calculating. Write the units or the multiplier first, then check the result against the original data.
Unit and scale conversion: make the denominator real
The areas are 0.4 and 0.6 km², and one km² is 100 hectares. Convert the area first, then divide the final-spring count by it.
Area in hectares
Seedlings per hectare
Tempting wrong answer
Divides by the area in km². That is a valid different unit, not the requested hectares.
Right setup
Converts the area to hectares before dividing, so the unit matches the question.
A number without its unit can hide that mistake. Convert the area before dividing, or divide in km² and then convert the resulting density in the opposite direction.
Try a Redrock practice question on this: case 4, a per-transect rate with its unit.
Reverse percentage: undo multiplication with division
Suppose the final-spring count 300 is described as 25% above the previous count and that previous row is hidden. “Above” means the final count is the original multiplied by 1 + 25%, so divide by that factor to recover it.
Reverse percentage
Tempting wrong answer
Subtracts 25% of the final count. The percentage was applied to the smaller starting count, not to this one.
Right setup
Undoes the multiplication with a division by the same factor.
Multiply your recovered number forward by the growth factor; it must return 300.
Try a Redrock practice question on this: case 1, where the same multiply-forward check confirms the answer.
How should you choose a chart and check a numerical answer?
In this survey, a line chart fits change across springs, bars fit Ridge versus Valley in one spring, and a part-to-whole display fits their shares; chart choices appear in candidate accounts, but no chart syllabus or rounding tolerance is public. Choose a chart from the question’s relationship, then check whether its labels preserve period, unit and denominator. The drawings are a study aid, not a claim about which chart options appear in a live sitting.
Line, spring on the horizontal axis. Keep the intervals in order and label the count.
Bars by zone. Use the same spring and count unit for both bars.
Part-to-whole bar. Confirm the two zone parts exhaust the combined total.
A separate candidate account might mention probability, mean, median or mode. McKinsey has not confirmed those Red Rock topics, so keep them as conditional practice: for a mean, add observations and divide by their count; for a median, order them and find the middle; for probability, define the event and sample space before combining chances. Those rules are mathematical definitions, not leaked assessment questions. Do not assume independent events merely because two observations look similar.
Finally, use the precision requested on your own screen. Keep intermediate values intact and round only the final result, because early rounding can change a comparison or a reverse calculation. There is no public McKinsey Red Rock universal decimal rule or accepted tolerance. The test-day guide covers official setup and integrity instructions, the invitation guide explains which details to read from your own email, and the guide on how to prepare for McKinsey Solve helps place this math drill among the other games. After one independent Red Rock run, record whether your error was a denominator, a unit, a period, or a misread question; the seven Red Rock mistakes guide shows the fix for each. That directs your next drill more effectively than repeating every formula.
Try a Redrock practice question on this: case 5, choosing a chart for monthly readings.
Which Redrock math mistakes cost the most?
Seven Redrock math mistakes do the most damage in our practice method: the wrong base, percent versus percentage points, a unit slip, averaging rates, an irrelevant exhibit, answering a different question and rounding too early. This order is our diagnostic method, not a McKinsey ranking, and no Red Rock error data or per-error penalty is public. The first four are worked above. The last three are worked below on the same survey.
| Symptom | Likely check | Next drill |
|---|---|---|
| Answer differs by a base | Starting versus ending count | Write the base in words before dividing. |
| Correct digits, wrong “%” label | Percent change versus percentage points | Answer both versions of the same rate question. |
| Magnitude is far off | km² versus hectares, or another unit | Write and check the conversion beside the result. |
| Overall rate sits between zone rates but disagrees | Unweighted average versus pooled counts | Add numerators and denominators before dividing. |
| Formula uses a prominent unrelated total | Wrong exhibit or population | Cross out inputs that do not match the question. |
| Plausible value, wrong label | Different zone, period or requested measure | Underline quantity, period, population and unit. |
| Close numeric result | Early rounding | Repeat with full precision until the final entry. |
An irrelevant exhibit: the largest total is not the base
Suppose a separate visitor exhibit records 2400 site visits. For the overall healthy rate, dividing 63 healthy seedlings by those visits gives 2.625%, a number that describes no population. The base is the seedlings inspected.
Tempting wrong answer
Divides seedlings by visits. Both are real entries in the study, but the result mixes two populations.
Right setup
“Of the seedlings inspected” names the population, so the inspected total is the base.
Answering a different question: a count where a rate was asked
If the prompt asks for Valley’s inspected health rate, the answer is 60%, not Valley’s 36 healthy seedlings. Both numbers sit in the same row, which is why the nearer one is tempting. Circle the requested zone, period, measure and unit before calculating.
Answers another question
Copies the healthy count. The question asked for a rate, so a count cannot be the answer.
Answers this question
Divides Valley’s healthy seedlings by the seedlings inspected in Valley.
Rounding too early: keep full precision until the last step
Project the final-spring count 2 more intervals at the constant rate worked above. Keeping the rate at full precision gives 450 seedlings; rounding it to 22% first gives 446.52, about 447. This is an exercise, not a McKinsey rounding rule: follow the precision your own screen asks for.
Rounds early
Rounds 22.47% to 22% and then compounds the rounding error.
Rounds once, at the end
Carries the unrounded factor through both intervals and rounds only the final count.
After an independent practice run, find the first point where your working diverged from the worked answer and pick one drill from the table. A final answer alone cannot show whether you used a wrong exhibit, a wrong operation or a correct method with a typing slip. To practise all seven on fresh numbers, work the McKinsey Redrock practice questions.
Sources and evidence boundaries
- Official, checked October 11, 2026: McKinsey’s Solve page calls Solve a gamified recruiting assessment; the August 2025 Solve FAQ says each task starts with an untimed tutorial and the invitation states the assessment length.
- Official integrity boundary, checked October 11, 2026: McKinsey’s assessment integrity expectations bar outside calculators, applications, websites, prepared notes, recordings and help from others; the Solve FAQ also bars outside applications, websites and AI tools. Follow any written accommodation and your live instructions.
- Reported, unverified: candidates describe Red Rock’s arithmetic, charts, research journal and an in-game calculator. McKinsey has not named Red Rock in the sources reviewed or published its exact topic mix, question count, rounding tolerance or scoring weights.
- Original teaching work: the seedling survey, calculations, wrong-answer diagnoses and shortcuts were created for this article. The values come from the accompanying dataset and are recomputed by its test; they are not real assessment content.