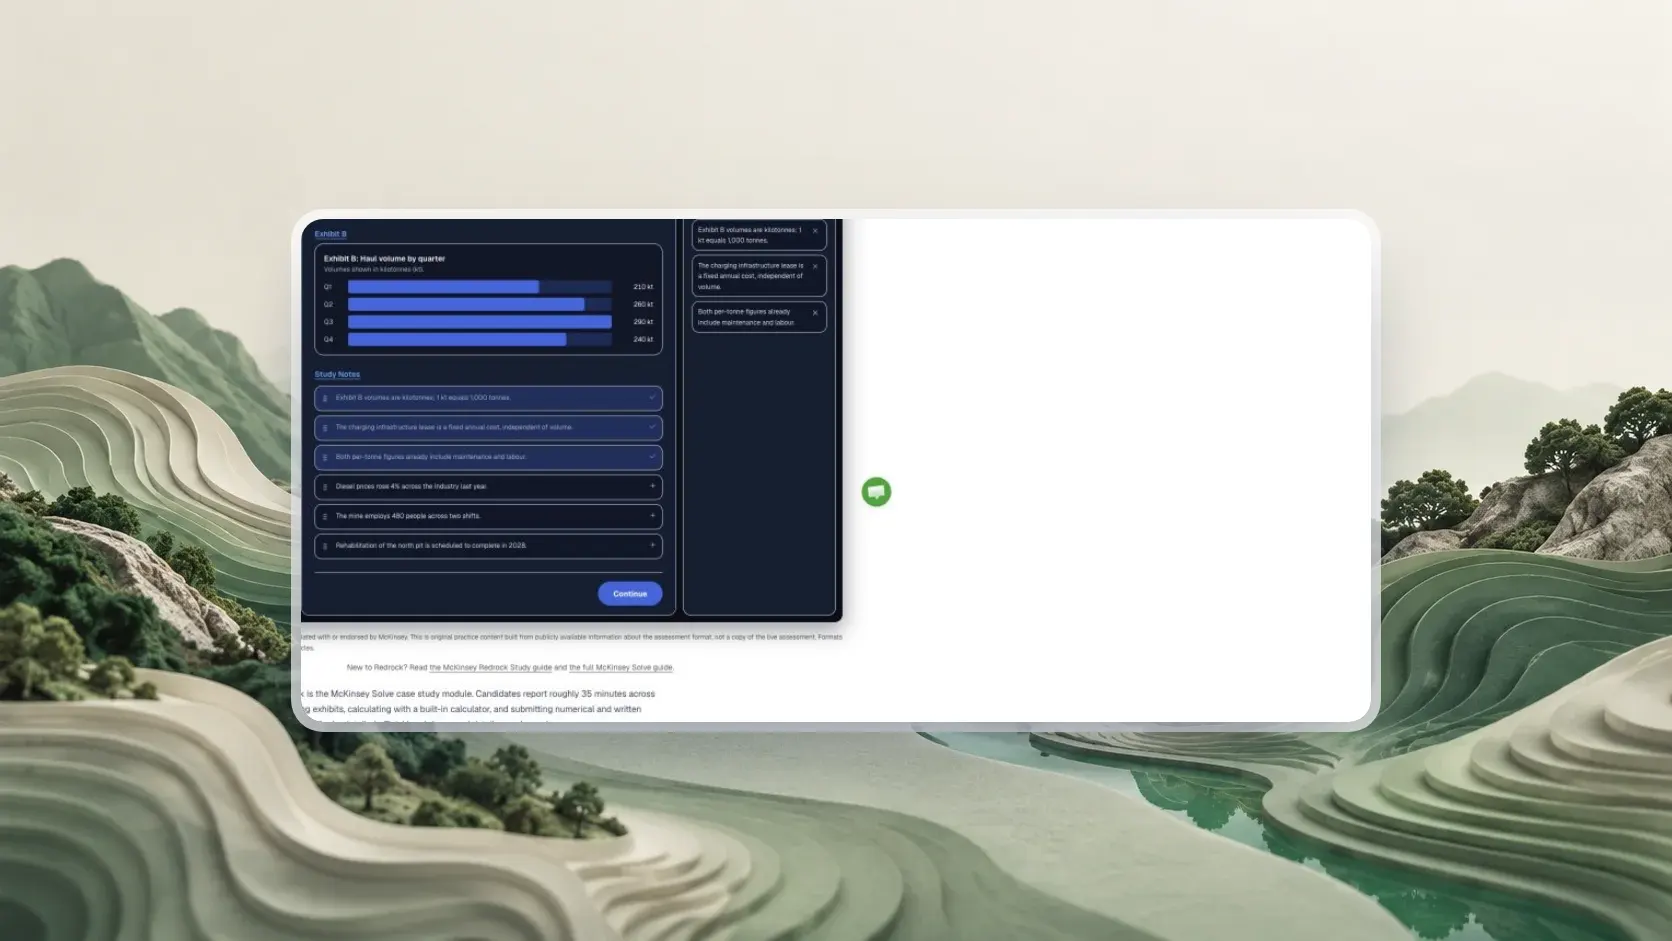
McKinsey publishes no Red Rock practice questions or answer key, so the six mini-cases here are original and fictional, covering the calculation types candidates report: percentage change, a share, a pooled rate, a unit rate, a chart choice and a written finding. Attempt each one before you open its working. Nothing here is a McKinsey question, and the case types are candidate-reported, not confirmed by McKinsey.
| Question | Answer | Status |
|---|---|---|
| Does McKinsey publish practice questions? | No. It says no preparation is needed. | Official |
| Do two candidates get the same data? | McKinsey says not: scenarios vary. | Official |
| Six short Cases after the Study? | Candidates describe six standalone Cases on a shared clock of about 35 minutes. | Reported |
| Which calculation types appear? | Candidates mention percentages, shares, averages, ratios and charts. No frequency is known. | Reported |
| Is there an answer key or mark scheme? | None is published. | Not published |
Where can you find Red Rock practice questions with answers?
You will not find official ones: McKinsey publishes no Red Rock practice questions or answer key, and its Solve FAQ says "No preparation is needed," so every item below is an original, fictional mini-case written for this guide with full working. Anything presented as a real Red Rock item cannot be verified, and memorised numbers would not transfer.
What does transfer is the setup: which number is the base, which total is the whole, which groups need weights. That is why every case here follows the same order. You see a small exhibit and a question, you commit to an answer on paper, and only then do you open the working. McKinsey has not confirmed the reported six case types or their mix. Your invitation and the tutorial on your own screen decide what you actually meet. For the format those cases sit in, read the Red Rock format and practice guide. For the whole assessment, start at the McKinsey Solve guide and McKinsey's own Solve page.
Opening your Red Rock run…
The Red Rock run did not open here.
Is there a McKinsey Redrock answers PDF?
No official one exists, as a PDF or in any other form, and the FAQ says scenarios vary between candidates, so a downloaded answer list would not match your data. What you can use instead is original practice with worked answers, which is what this page gives you. The answers-at-a-glance table below lists every item's right setup and tempting wrong answer on one screen, so you can check yourself without scrolling back through the working.
We also offer a complete free Red Rock run: the full Study and six standalone Cases, with 12 scored decisions worth 35 points and a 35-minute practice clock. Play the Red Rock Study with no account; a free account (no card) unlocks the six Cases, your score and the worked answers for your right decisions and biggest miss. No payment is required for the first run, whose review shows where points went and worked answers for your right decisions and biggest miss, with highlighted calculations and charts.
One run is free in each of our four practice formats: Red Rock, Sea Wolf (Site 1), SFL Classic and SFL Island. Learning mode provides a step-by-step path with coaching and feedback as you go in all four, untimed in the clocked games, with the matching game pack, the Solve pack or qualifying Annual access. The Solve plan is free with a free account (no card) and turns your invitation length and test date into dated practice steps for up to 28 days.
How should you work a practice mini-case so the answer teaches you something?
Work each case in five steps, committing to an answer before you reveal the working, because a guess you wrote down is the only thing a worked answer can correct. This routine is editorial advice, not a McKinsey rule or scoring method. No time per case is published.
- Read the question first. Know whether it asks for a percentage, a share, a rate or a choice before you look at the exhibit.
- Copy the figures with labels. Group, period and unit beside each number, so a base cannot come from the wrong row.
- Write the setup in words. "Change divided by the start" or "part divided by its whole", then substitute.
- Write your answer, then reveal. Compare your setup with the working, not just the final number.
- Name the error. If you missed, label it: base, whole, weights, unit or display. The Redrock math mistakes table lists the common ones.
Keep a pen and paper beside you. McKinsey's assessment integrity page bans an outside calculator, and the in-game one is a reported feature, so build the habit of estimating first. The Red Rock calculator and journal section covers when each tool helps. If you want a timing target, build one from your own runs with the 35-minute time budget; do not treat a number on a practice page as McKinsey's.
How do you answer a percentage-change mini-case?
A percentage-change mini-case is solved by dividing the change by the starting value, not the ending value; case 1 below lets you try it on a trailhead counter. The word that decides the base is "from": a rise from 2023 means 2023 is the denominator. McKinsey has not published how often this type appears.
Counter data. The vertical scale starts at zero.
Question. By what percentage did visits rise from 2023 to 2024? Choose one: A) 11.11%, B) 12.5%, C) 600 or D) 28.6%.
Reveal the answer and working for case 1
The answer is B. The count went from 4800 to 5400, an increase of 600, and that increase is measured against the 2023 count.
Percentage change
Tempting wrong answer
Divides the increase by the ending count. That answers a different question: what share of the 2024 total the increase is.
Right setup
Divides by the 2023 count, the base that 'rise from 2023' names.
Option C is the raw increase with no rate, and option D measures from 2022, the first year on the chart, instead of 2023. Check by multiplying forward: 4800 plus 12.5% of itself must return 5400. The full set of percentage skills is in Red Rock math.
How do you find a share of a total?
A share is the part divided by the whole it belongs to, and the whole must include the part, so build the total before you divide; case 2 tests that on a camp water budget. The usual trap is dividing the part by everything else, which gives a ratio, not a share.
- Drinking120 litres · 15%
- Cooking200 litres · 25%
- Washing360 litres · 45%
- Cleaning120 litres · 15%
- Whole camp800 litres · 100%
Camp data. Each part is shown with its percentage of the whole.
Question. What percentage of the camp's daily water goes to washing, and does that match the figure you get by comparing washing with all the other uses together?
Reveal the answer and working for case 2
Washing is 45% of the daily total. The whole is every use added together, 800 litres, and washing is 360 of them.
Share of total
Tempting wrong answer
Divides washing by the other uses only (440 litres). That compares a part with the rest, so it can exceed 100%.
Right setup
Divides by the whole that washing belongs to. The four shares must add back to 100%.
So the two figures do not match, and the second one is not a share at all. Sanity check: a part cannot be more than the whole, and 15, 25, 45, 15 add to 100.
How do you combine rates from groups of different size?
You pool the counts first: add every success, add every attempt, then divide, because an average of rates gives a small group the same weight as a large one. Case 3 puts three water stations with very different sample sizes in front of you. This is the pooled-rate idea from the math guide on fresh numbers, and McKinsey does not say how often a weighting question appears.
Sampling data. The notes give each station's sample size.
Question. What percentage of all samples passed across the three stations? Do not round until the end.
Reveal the answer and working for case 3
60% of all samples passed. Add the passes (18 + 30 + 12) and the samples (20 + 50 + 30) before dividing.
Pooled rate
Equal-weight trap
Averages the three rates, which gives the 20-sample station the same influence as the 50-sample one.
Pool first
Total passes over total samples. Each station is weighted by how many samples it contributed.
The check is direction: the pooled rate must sit closest to the station with the most samples. Mid contributed half the samples, and its 60% pulls the answer toward it.
How do you compare rates when the totals are not equal?
You divide each total by its own count to get a unit rate, then compare the rates, because the biggest or smallest total says nothing about efficiency; case 4 uses three survey boats. Anything described as "per" something is a rate, and the units of the answer must say so. No list of ratio question styles is published, so treat this as a reported type.
Boat logs. The bars show fuel, so they do not show efficiency.
Question. Which boat used the least fuel per transect, and how much fuel would 40 transects need at that rate?
Reveal the answer and working for case 4
Egret is the most economical at 5 litres per transect, and 40 transects need 200 litres. Work out all three rates before choosing.
Fuel for the plan
Tempting wrong answer
Picks Heron for the smallest total (60 litres). That boat covered the fewest transects and is the thirstiest per transect.
Right setup
Compares fuel divided by transects, so the boats are measured on the same basis.
The smallest bar was the worst choice. When a total and a count both appear, ask what the question divides by.
How do you choose the chart a mini-case asks for?
You choose the display from the relationship the message needs to show, and for a measure that moves across ordered months that display is a line in time order; case 5 gives you lagoon readings and asks you to pick. No list of the chart types offered is published, so the lesson here is the reasoning, not a menu.
Readings, one per month, January to June.
Question. A report must show how the lagoon warmed from January to June. Which display fits best? Choose one: A) parts of a whole, B) a line with the months in order, C) bars ranked from highest to lowest, D) a single average figure. Then state the largest one-month rise.
Reveal the answer and working for case 5
The answer is B. The message is movement across ordered months, and a line keeps the order and the slope. Readings of temperature are not parts of a whole, a ranked bar chart breaks the calendar, and one average hides the climb.
Largest one-month rise
Whole period: 22 − 11 = 11 °C.
Tempting wrong answer
Sorts the readings from highest to lowest. The order now reads as a cooling, the opposite of what happened.
Right setup
Keeps the months in calendar order, so the climb of 11 °C reads left to right.
Percentage rise is the wrong measure for degrees Celsius, because zero is not an absence of heat, so the question asked for the size of the rise in degrees.
How do you write a one-sentence finding from an exhibit?
You state each comparison with its own unit and base in one sentence, and you never compare a percentage with a number of points. Case 6 shows why on two reefs, where one loses more points and the other loses more of what it had. Candidates describe a written Report step in the Study, but no marking guide for it is published, so this is practice in clear wording, not a template to memorise.
- Reef A
- Reef B
Survey data. Cover is the percentage of the surveyed area with live coral.
Question. Which sentence is the most accurate finding for the change from Survey 1 to Survey 4? A) Reef B lost 20%, which is more than Reef A's 6 points, so Reef B lost more. B) Reef A lost more points of cover, but Reef B lost a larger share of its own starting cover. C) Reef A is healthier because its cover is higher.
Reveal the answer and working for case 6
The answer is B. Reef A fell 6 points and Reef B fell 4 points, so A lost more points. Measured against its own start, Reef B lost more.
Tempting wrong answer
Sets a 20% relative loss against 6 points. One is a share of a base and the other is a difference, so they cannot be ranked.
Right setup
Compares like with like: points against points, share against share. Then says both.
A model sentence: "From Survey 1 to Survey 4, Reef A lost 6 points of cover and Reef B lost 4, but Reef B lost 20% of its starting cover against 10% for Reef A." Option C ignores direction altogether: a higher level says nothing about change.
How do you choose the evidence an Investigation question asks for?
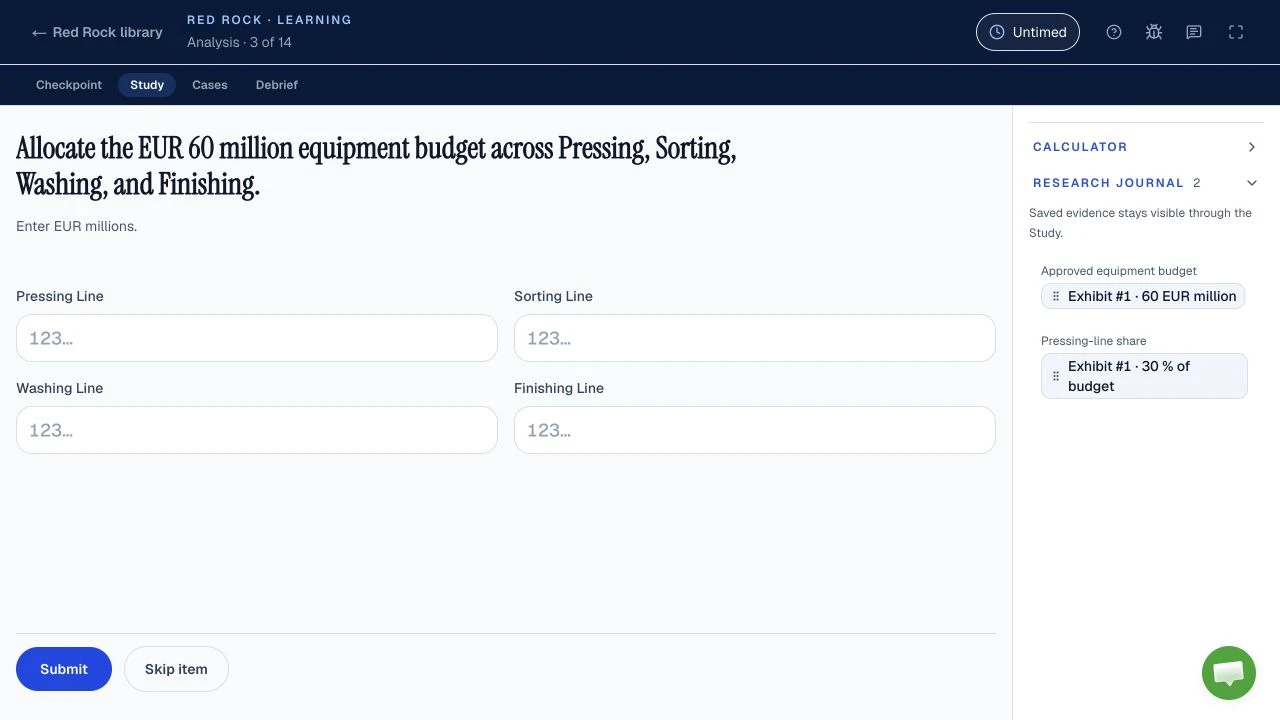
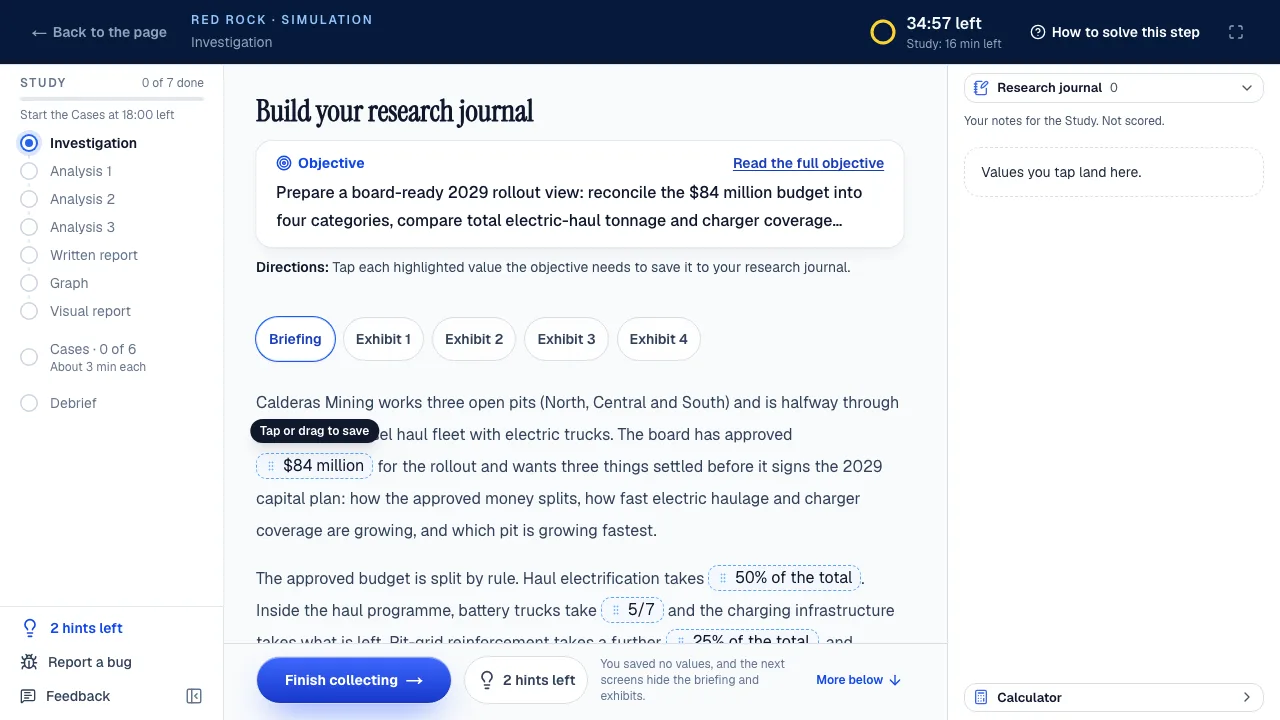
You pick the exhibits that measure exactly what the research objective names, and set aside the ones that only sound related; item 7 is an Investigation question that tests that choice before any arithmetic. The Redrock Study reportedly opens with this kind of evidence collection into a research journal, though McKinsey has not published how it works. This item is original practice, not a McKinsey question.
Compare how much water each of two field camps uses per person per day. Four exhibits are available: A) daily water use at each camp, in litres; B) the number of people staying at each camp; C) rainfall at each camp last month, in millimetres; D) the distance from each camp to the nearest river, in kilometres.
Question. Which two exhibits answer the objective, and which one is the most tempting distractor?
Reveal the answer and working for item 7
A and B answer it: "per person per day" is daily litres divided by people, so you need the daily use and the headcount, each with its unit. C is the tempting distractor. It is about water, but rainfall measures weather, not use, so it cannot sit in the numerator or the denominator. D is unrelated to the objective.
Write the setup before saving anything: "litres per day ÷ people". Every exhibit that cannot fill one of those two slots stays out of the journal. If a later question asks about supply, rainfall may matter then; it does not matter for this objective.
What are all the Redrock practice answers at a glance?
Here is every answer on one screen: the right setup, the result and the tempting wrong answer for each item, plus the part of Redrock it rehearses. The stage mapping is our editorial reading of where each skill is reported to appear, not a McKinsey blueprint; candidates describe calculations in Analysis and in the Cases, charts and findings in the Report, and evidence selection in Investigation.
| Item | Type | Right setup and answer | Tempting wrong answer | Rehearses |
|---|---|---|---|---|
| 1 | Percentage change | 600 / 4800 = 12.5% | 11.11% (divided by the ending count) | Study Analysis or a Case |
| 2 | Share of a total | 360 / 800 = 45% | 81.82% (divided by the other uses) | Study Analysis or a Case |
| 3 | Pooled rate | 60 / 100 = 60% | 63.33% (averaged the rates) | Study Analysis or a Case |
| 4 | Unit rate | Egret, 5 litres per transect; 200 litres for 40 transects | Heron (smallest total, not smallest rate) | A Case |
| 5 | Chart choice | Option B, a line in month order; largest rise 4 °C | Option C, bars ranked high to low | Study Report |
| 6 | Written finding | Option B: Reef A lost more points (6 vs 4), Reef B a larger share (20% vs 10%) | Option A, which ranks a percentage against points | Study Report |
| 7 | Evidence selection | Exhibits A and B (litres per day ÷ people) | Exhibit C, rainfall, which is about water but not use | Study Investigation |
What should you do after the six cases?
Sort every miss into one error type and drill that type, because the six cases are built so each wrong answer has a recognisable cause. The table pairs each case with its trap and a one-line check. It is an editorial summary of these items, not a prediction of what you will meet.
| Case | Tempting trap | Quick check |
|---|---|---|
| 1 Percentage change | Dividing by the ending count | Multiply the start forward to the end |
| 2 Share | Dividing by the other parts | All shares add to 100 |
| 3 Pooled rate | Averaging the rates | Answer sits nearest the biggest group |
| 4 Unit rate | Choosing by the total | Say what is on top and underneath |
| 5 Chart choice | Ranking ordered months | Read the display left to right |
| 6 Written finding | Mixing points and percent | Same unit on both sides of each comparison |
If your misses cluster in two or three rows, go to the matching guide: Red Rock math for the arithmetic, Redrock math mistakes for the habits behind the traps, and the 35-minute time budget if you ran out of clock. To decide whether this game or the other one needs your next evening, use Red Rock vs Sea Wolf; the rules-based Sea Wolf math uses averages in a different way. For the skills the games are described as measuring, see what Solve measures.
Spread the practice across days rather than one long evening: the prep plan shows how, the tips guide lists the habits worth rehearsing, and where Solve gets hard says where candidates reportedly lose points. For what is and is not known about any cutoff you read online, see the pass-rate guide. If your invitation has not arrived, the Solve FAQ, the 65, 85 and 95 minute guide and the test-day checklist cover what to line up. The device side is in system requirements and tech issues.
Sources and evidence boundaries
- Official, checked October 11, 2026: McKinsey's Solve page and the August 2025 Solve FAQ say no preparation is needed, that each task starts with an untimed tutorial, and that scenarios vary so that no two individuals have the same parameters and data. The assessment integrity page bans an outside calculator and prepared notes.
- Reported, unverified: the Study followed by six standalone Cases on a shared clock of about 35 minutes, an in-game calculator and a research journal, and the case types of percentage, share, average, ratio and chart questions. These come from candidate accounts, and McKinsey has not confirmed them.
- Not published in the official sources checked: any Red Rock question, answer key, mark scheme, score scale, pass mark, time per case, chart list or frequency of each question type.
- Our work: all six cases, their numbers, the routine and the trap table are original editorial material, recomputed by an automated test. They are practice for reasoning, not McKinsey questions, and our practice is independent of McKinsey.